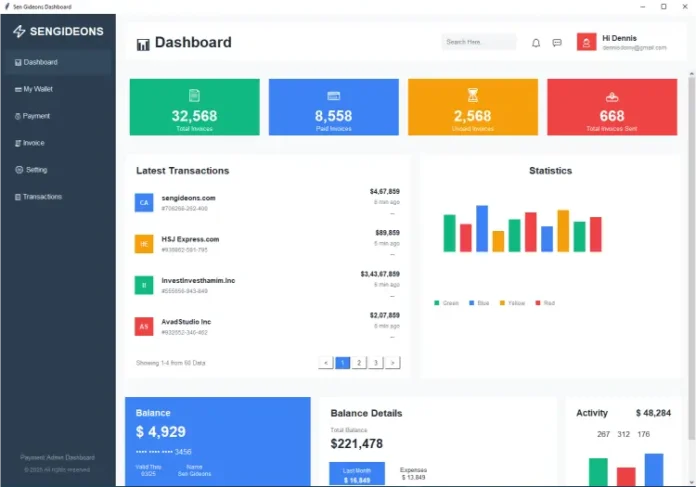
The dashboard is divided into two main sections:
Sidebar Navigation: A vertical panel with intuitive navigation buttons, a logo, and a footer.
Main Content Area: Includes a top header with search and user profile, colorful metric cards, a list of recent transactions, and a placeholder statistics section.
It uses a consistent color palette, emoji icons, and Frame, Label, and Button widgets to structure and beautify the layout.
What’s Inside the Code?
1. Sidebar Navigation
The sidebar contains:
- A title/logo area
- Navigation buttons like Dashboard, Wallet, Payment, etc.
- A footer with branding info
This part of the interface is fixed-width and provides quick access to different parts of the dashboard.
2. Main Header
The header includes:
- A dashboard title
- A search bar
- Notification icons (🔔, 💬)
- A user profile section
It’s designed to make the user feel welcome and informed right from the top.
3. Metric Cards
Four vibrant cards showcase:
- Total Invoices
- Paid Invoices
- Unpaid Invoices
- Invoices Sent
Each card includes:
- An icon
- A numeric value
- A label
These are styled using color-coded backgrounds for visual differentiation.
4. Middle Section: Transactions & Statistics
This section has two columns:
Left: A list of the latest transactions, showing site names, transaction amounts, and timestamps.
Right: A placeholder for statistics (bar charts or graphs can be added here later).
Complete Source Code
Key Implementation Details
1. Modern UI Design
We’ve created a professional color scheme using hex codes:
How It Works
Here’s a breakdown of how everything ties together:
- Classes & Methods: The PelioDashboard class manages layout and content creation.
- Color Management: A dictionary of color values keeps styling consistent across components.
- Data Simulation: Random sample data and placeholder UI elements make it easy to test functionality.
Code
    def create_sidebar(self):
        """Create the left sidebar navigation"""
        self.sidebar = Frame(self.root, bg=self.colors['sidebar'], width=250)
        self.sidebar.pack(side='left', fill='y')
        self.sidebar.pack_propagate(False)

        # Logo and title
        logo_frame = Frame(self.sidebar, bg=self.colors['sidebar'])
        logo_frame.pack(fill='x', pady=20)

        # Pelio logo placeholder
        logo_label = Label(logo_frame, text="⚡ SENGIDEONS", font=('Arial', 18, 'bold'),
                             fg='white', bg=self.colors['sidebar'])
        logo_label.pack(padx=20)

        # Navigation items
        nav_items = [
            ("📊 Dashboard", True),
            ("💳 My Wallet", False),
            ("💰 Payment", False),
            ("🧾 Invoice", False),
            ("⚙️ Setting", False),
            ("📋 Transactions", False)
        ]

        for item, is_active in nav_items:
            bg_color = '#34495e' if is_active else self.colors['sidebar']
            fg_color = 'white'

            nav_button = Button(self.sidebar, text=item, font=('Arial', 11),
                                  bg=bg_color, fg=fg_color, bd=0, pady=15,
                                  anchor='w', padx=20, cursor='hand2')
            nav_button.pack(fill='x', padx=10, pady=2)

        # Bottom section
        bottom_frame = Frame(self.sidebar, bg=self.colors['sidebar'])
        bottom_frame.pack(side='bottom', fill='x', pady=20)

        Label(bottom_frame, text="Payment Admin Dashboard",
                font=('Arial', 10), fg='#95a5a6', bg=self.colors['sidebar']).pack(padx=20)
        Label(bottom_frame, text="© 2025 All rights reserved.",
                font=('Arial', 9), fg='#7f8c8d', bg=self.colors['sidebar']).pack(padx=20, pady=5)

    def create_main_content(self):
        """Create the main content area"""
        self.main_frame = Frame(self.root, bg=self.colors['main_bg'])
        self.main_frame.pack(side='right', fill='both', expand=True)

        # Header
        self.create_header()

        # Content container with scrollable area
        content_canvas = Canvas(self.main_frame, bg=self.colors['main_bg'], highlightthickness=0)
        scrollbar = ttk.Scrollbar(self.main_frame, orient="vertical", command=content_canvas.yview)
        self.scrollable_frame = Frame(content_canvas, bg=self.colors['main_bg'])

        self.scrollable_frame.bind(
            "<Configure>",
            lambda e: content_canvas.configure(scrollregion=content_canvas.bbox("all"))
        )

        content_canvas.create_window((0, 0), window=self.scrollable_frame, anchor="nw")
        content_canvas.configure(yscrollcommand=scrollbar.set)

        content_canvas.pack(side="left", fill="both", expand=True)
        scrollbar.pack(side="right", fill="y")

        # Create dashboard sections
        self.create_metric_cards()
        self.create_middle_section()
        self.create_bottom_section()

    def create_header(self):
        """Create the top header with search and user info"""
        header = Frame(self.main_frame, bg=self.colors['white'], height=80)
        header.pack(fill='x', padx=20, pady=20)
        header.pack_propagate(False)

        # Dashboard title
        Label(header, text="📊 Dashboard", font=('Arial', 24, 'bold'),
                fg=self.colors['text_dark'], bg=self.colors['white']).pack(side='left', padx=20, pady=20)

        # Right side - search and user
        right_frame = Frame(header, bg=self.colors['white'])
        right_frame.pack(side='right', padx=20, pady=20)

        # Search box
        search_frame = Frame(right_frame, bg='#f3f4f6', relief='flat')
        search_frame.pack(side='left', padx=10)

        search_entry = Entry(search_frame, font=('Arial', 10), bg='#f3f4f6',
                               bd=0, width=20, fg=self.colors['text_light'])
        search_entry.pack(side='left', padx=10, pady=8)
        search_entry.insert(0, "Search Here...")

        # Notification badges
        notif_frame = Frame(right_frame, bg=self.colors['white'])
        notif_frame.pack(side='left', padx=10)

        # Bell icon with badge
        bell_btn = Button(notif_frame, text="🔔", font=('Arial', 16),
                            bg=self.colors['white'], bd=0, cursor='hand2')
        bell_btn.pack(side='left', padx=5)

        # Message icon with badge
        msg_btn = Button(notif_frame, text="💬", font=('Arial', 16),
                           bg=self.colors['white'], bd=0, cursor='hand2')
        msg_btn.pack(side='left', padx=5)

        # User profile
        user_frame = Frame(right_frame, bg=self.colors['white'])
        user_frame.pack(side='left', padx=10)

        # Profile picture placeholder
        profile_btn = Button(user_frame, text="👤", font=('Arial', 16),
                               bg=self.colors['card_red'], fg='white',
                               width=3, height=1, bd=0, cursor='hand2')
        profile_btn.pack(side='left')

        # User info
        user_info = Frame(user_frame, bg=self.colors['white'])
        user_info.pack(side='left', padx=10)

        Label(user_info, text="Hi Dennis", font=('Arial', 12, 'bold'),
                fg=self.colors['text_dark'], bg=self.colors['white']).pack(anchor='w')
        Label(user_info, text="dennisdorny@gmail.com", font=('Arial', 9),
                fg=self.colors['text_light'], bg=self.colors['white']).pack(anchor='w')

    def create_metric_cards(self):
        """Create the colorful metric cards"""
        cards_frame = Frame(self.scrollable_frame, bg=self.colors['main_bg'])
        cards_frame.pack(fill='x', padx=20, pady=10)

        # Card data
        cards_data = [
            ("32,568", "Total Invoices", self.colors['card_green'], "📄"),
            ("8,558", "Paid Invoices", self.colors['card_blue'], "💳"),
            ("2,568", "Unpaid Invoices", self.colors['card_yellow'], "⏳"),
            ("668", "Total Invoices Sent", self.colors['card_red'], "📤")
        ]

        for i, (value, label, color, icon) in enumerate(cards_data):
            card = Frame(cards_frame, bg=color, width=280, height=122)
            card.grid(row=0, column=i, padx=10, pady=10, sticky='ew')
            card.pack_propagate(False)

            # Icon
            Label(card, text=icon, font=('Arial', 20),
                    fg='white', bg=color).pack(pady=(15, 5))

            # Value
            Label(card, text=value, font=('Arial', 24, 'bold'),
                    fg='white', bg=color).pack()

            # Label
            Label(card, text=label, font=('Arial', 10),
                    fg='white', bg=color).pack(pady=(0, 10))

        # Configure grid weights
        for i in range(4):
            cards_frame.grid_columnconfigure(i, weight=1)

    def create_middle_section(self):
        """Create the middle section with transactions and statistics"""
        middle_frame = Frame(self.scrollable_frame, bg=self.colors['main_bg'])
        middle_frame.pack(fill='x', padx=20, pady=20)

        # Left side - Latest Transactions
        left_frame = Frame(middle_frame, bg=self.colors['white'], relief='flat', bd=1)
        left_frame.pack(side='left', fill='both', expand=True, padx=(0, 10))

        # Transactions header
        trans_header = Frame(left_frame, bg=self.colors['white'])
        trans_header.pack(fill='x', padx=20, pady=(20, 10))

        Label(trans_header, text="Latest Transactions", font=('Arial', 16, 'bold'),
                fg=self.colors['text_dark'], bg=self.colors['white']).pack(side='left')

        # Transactions list
        self.create_transactions_list(left_frame)

        # Right side - Statistics
        right_frame = Frame(middle_frame, bg=self.colors['white'], relief='flat', bd=1)
        right_frame.pack(side='right', fill='both', expand=True, padx=(10, 0))

        # Statistics header
        stats_header = Frame(right_frame, bg=self.colors['white'])
        stats_header.pack(fill='x', padx=20, pady=(20, 10))

        Label(stats_header, text="Statistics", font=('Arial', 16, 'bold'),
                fg=self.colors['text_dark'], bg=self.colors['white']).pack()

        # Create simple bar chart
        self.create_statistics_chart(right_frame)

    def create_transactions_list(self, parent):
        """Create the transactions list"""
        transactions_data = [
            ("sengideons.com", "$4,67,859", "6 min ago", self.colors['card_blue'], "CA"),
            ("HSJ Express.com", "$89,859", "6 min ago", self.colors['card_yellow'], "HE"),
            ("InvestInvesthamim.Inc", "$3,43,67,859", "6 min ago", self.colors['card_green'], "II"),
            ("AvadStudio Inc", "$2,07,859", "6 min ago", self.colors['card_red'], "AS")
        ]

        for company, amount, time, color, initials in transactions_data:
            trans_row = Frame(parent, bg=self.colors['white'])
            trans_row.pack(fill='x', padx=20, pady=8)

            # Company icon
            icon_frame = Frame(trans_row, bg=color, width=40, height=40)
            icon_frame.pack(side='left', padx=(0, 15))
            icon_frame.pack_propagate(False)

            Label(icon_frame, text=initials, font=('Arial', 10, 'bold'),
                    fg='white', bg=color).place(relx=0.5, rely=0.5, anchor='center')

            # Company details
            details_frame = Frame(trans_row, bg=self.colors['white'])
            details_frame.pack(side='left', fill='x', expand=True)

            Label(details_frame, text=company, font=('Arial', 11, 'bold'),
                    fg=self.colors['text_dark'], bg=self.colors['white']).pack(anchor='w')
            Label(details_frame, text=f"#{random.randint(100000, 999999)}-{random.randint(100, 999)}-{random.randint(100, 999)}",
                    font=('Arial', 9), fg=self.colors['text_light'], bg=self.colors['white']).pack(anchor='w')

            # Amount and time
            right_details = Frame(trans_row, bg=self.colors['white'])
            right_details.pack(side='right')

            Label(right_details, text=amount, font=('Arial', 11, 'bold'),
                    fg=self.colors['text_dark'], bg=self.colors['white']).pack(anchor='e')
            Label(right_details, text=time, font=('Arial', 9),
                    fg=self.colors['text_light'], bg=self.colors['white']).pack(anchor='e')

            # Action button
            Button(right_details, text="⋯", font=('Arial', 12),
                     bg=self.colors['white'], bd=0, cursor='hand2').pack(side='right', padx=10)

        # Pagination
        pagination = Frame(parent, bg=self.colors['white'])
        pagination.pack(fill='x', padx=20, pady=20)

        Label(pagination, text="Showing 1-4 from 60 Data", font=('Arial', 10),
                fg=self.colors['text_light'], bg=self.colors['white']).pack(side='left')

        # Page numbers
        page_frame = Frame(pagination, bg=self.colors['white'])
        page_frame.pack(side='right')

        for i, page in enumerate(['<', '1', '2', '3', '>']):
            bg = self.colors['card_blue'] if page == '1' else self.colors['white']
            fg = 'white' if page == '1' else self.colors['text_dark']

            Button(page_frame, text=page, font=('Arial', 10),
                     bg=bg, fg=fg, bd=1, width=3, cursor='hand2').pack(side='left', padx=2)

    def create_statistics_chart(self, parent):
        """Create a simple statistics chart"""
        chart_frame = Frame(parent, bg=self.colors['white'], height=200)
        chart_frame.pack(fill='x', padx=20, pady=20)
        chart_frame.pack_propagate(False)

        # Simple bar chart using canvas
        canvas = Canvas(chart_frame, bg=self.colors['white'], height=150, highlightthickness=0)
        canvas.pack(fill='both', expand=True)

        # Draw bars
        bar_colors = [self.colors['card_green'], self.colors['card_red'],
                     self.colors['card_blue'], self.colors['card_yellow']]
        bar_heights = [80, 60, 100, 45, 70, 85, 55, 90, 65, 75]

        bar_width = 25
        spacing = 35
        start_x = 30

        for i, height in enumerate(bar_heights):
            x = start_x + i * spacing
            color = bar_colors[i % len(bar_colors)]

            # Draw bar
            canvas.create_rectangle(x, 130 - height, x + bar_width, 130,
                                  fill=color, outline="")

        # Legend
        legend_frame = Frame(parent, bg=self.colors['white'])
        legend_frame.pack(fill='x', padx=20, pady=10)

        legend_items = [("Green", self.colors['card_green']), ("Blue", self.colors['card_blue']),
                       ("Yellow", self.colors['card_yellow']), ("Red", self.colors['card_red'])]

        for label, color in legend_items:
            item_frame = Frame(legend_frame, bg=self.colors['white'])
            item_frame.pack(side='left', padx=10)

            # Color dot
            dot = Frame(item_frame, bg=color, width=10, height=10)
            dot.pack(side='left', padx=(0, 5))

            Label(item_frame, text=label, font=('Arial', 9),
                    fg=self.colors['text_light'], bg=self.colors['white']).pack(side='left')

    def create_bottom_section(self):
        """Create the bottom section with balance and activity"""
        bottom_frame = Frame(self.scrollable_frame, bg=self.colors['main_bg'])
        bottom_frame.pack(fill='x', padx=20, pady=20)

        # Left side - Balance Card
        balance_frame = Frame(bottom_frame, bg=self.colors['card_blue'], width=400, height=200)
        balance_frame.pack(side='left', fill='y', padx=(0, 10))
        balance_frame.pack_propagate(False)

        # Balance header
        Label(balance_frame, text="Balance", font=('Arial', 14, 'bold'),
                fg='white', bg=self.colors['card_blue']).pack(anchor='w', padx=20, pady=(20, 5))

        # Amount
        Label(balance_frame, text="$ 4,929", font=('Arial', 24, 'bold'),
                fg='white', bg=self.colors['card_blue']).pack(anchor='w', padx=20)

        # Card number
        Label(balance_frame, text="•••• •••• •••• 3456", font=('Arial', 12),
                fg='white', bg=self.colors['card_blue']).pack(anchor='w', padx=20, pady=(10, 0))

        # Card details
        details_frame = Frame(balance_frame, bg=self.colors['card_blue'])
        details_frame.pack(anchor='w', padx=20, pady=10)

        Label(details_frame, text="Valid Thru\n03/25", font=('Arial', 9),
                fg='white', bg=self.colors['card_blue']).pack(side='left')

        Label(details_frame, text="Name\nSen Gideons", font=('Arial', 9),
                fg='white', bg=self.colors['card_blue']).pack(side='left', padx=(30, 0))

        # Middle section - Balance Details
        middle_frame = Frame(bottom_frame, bg=self.colors['white'])
        middle_frame.pack(side='left', fill='both', expand=True, padx=10)

        # Balance Details header
        Label(middle_frame, text="Balance Details", font=('Arial', 16, 'bold'),
                fg=self.colors['text_dark'], bg=self.colors['white']).pack(anchor='w', padx=20, pady=(20, 10))

        # Total Balance
        Label(middle_frame, text="Total Balance", font=('Arial', 10),
                fg=self.colors['text_light'], bg=self.colors['white']).pack(anchor='w', padx=20)
        Label(middle_frame, text="$221,478", font=('Arial', 20, 'bold'),
                fg=self.colors['text_dark'], bg=self.colors['white']).pack(anchor='w', padx=20, pady=(0, 10))

        # Monthly stats
        stats_row = Frame(middle_frame, bg=self.colors['white'])
        stats_row.pack(fill='x', padx=20, pady=10)

        # Last Month
        left_stat = Frame(stats_row, bg=self.colors['card_blue'], width=120, height=50)
        left_stat.pack(side='left', padx=(0, 10))
        left_stat.pack_propagate(False)

        Label(left_stat, text="Last Month", font=('Arial', 9),
                fg='white', bg=self.colors['card_blue']).pack(pady=(8, 0))
        Label(left_stat, text="$ 16,849", font=('Arial', 11, 'bold'),
                fg='white', bg=self.colors['card_blue']).pack()

        # Expenses
        Label(stats_row, text="Expenses\n$ 13,849", font=('Arial', 10),
                fg=self.colors['text_dark'], bg=self.colors['white']).pack(side='left', padx=20)

        # Other stats
        other_stats = Frame(middle_frame, bg=self.colors['white'])
        other_stats.pack(fill='x', padx=20, pady=10)

        Label(other_stats, text="Income     $255.25", font=('Arial', 10),
                fg=self.colors['text_dark'], bg=self.colors['white']).pack(anchor='w')
        Label(other_stats, text="Total       $365,478", font=('Arial', 10),
                fg=self.colors['text_dark'], bg=self.colors['white']).pack(anchor='w', pady=(5, 0))

        # Right side - Activity
        activity_frame = Frame(bottom_frame, bg=self.colors['white'], width=250)
        activity_frame.pack(side='right', fill='y', padx=(10, 0))
        activity_frame.pack_propagate(False)

        # Activity header
        activity_header = Frame(activity_frame, bg=self.colors['white'])
        activity_header.pack(fill='x', padx=20, pady=(20, 10))

        Label(activity_header, text="Activity", font=('Arial', 14, 'bold'),
                fg=self.colors['text_dark'], bg=self.colors['white']).pack(side='left')
        Label(activity_header, text="$ 48,284", font=('Arial', 14, 'bold'),
                fg=self.colors['text_dark'], bg=self.colors['white']).pack(side='right')

        # Activity stats
        stats_frame = Frame(activity_frame, bg=self.colors['white'])
        stats_frame.pack(fill='x', padx=20, pady=10)

        Label(stats_frame, text="267    312    176", font=('Arial', 12),
                fg=self.colors['text_dark'], bg=self.colors['white']).pack()

        # Activity chart (simplified)
        chart_canvas = Canvas(activity_frame, bg=self.colors['white'], height=100, highlightthickness=0)
        chart_canvas.pack(fill='x', padx=20, pady=10)

        # Draw simple bars
        colors = [self.colors['card_green'], self.colors['card_red'], self.colors['card_blue']]
        heights = [60, 40, 70]

        for i, (height, color) in enumerate(zip(heights, colors)):
            x = 30 + i * 60
            chart_canvas.create_rectangle(x, 80 - height, x + 40, 80, fill=color, outline="")

        # Month labels
        months = ["Sep", "Mar", "Apr"]
        for i, month in enumerate(months):
            x = 50 + i * 60
            chart_canvas.create_text(x, 90, text=month, font=('Arial', 9),
                                   fill=self.colors['text_light'])

        # Activity list
        activities = [
            "Dollars sit amet",
            "Dollars sit amet",
            "Dollars sit amet"
        ]

        for activity in activities:
            activity_row = Frame(activity_frame, bg=self.colors['white'])
            activity_row.pack(fill='x', padx=20, pady=2)

            # Color dot
            dot = Frame(activity_row, bg=self.colors['card_green'], width=8, height=8)
            dot.pack(side='left', padx=(0, 10))

            Label(activity_row, text=activity, font=('Arial', 9),
                    fg=self.colors['text_light'], bg=self.colors['white']).pack(side='left')

    def populate_data(self):
        """Populate dashboard with sample data"""
        pass  # Data is already populated in the creation methods
Why Tkinter for Dashboards?
Tkinter is:
- Easy to use and bundled with Python
- Highly customizable with basic widgets
- Great for creating lightweight desktop applications
🚀 Ready to Customize?
You can enhance this dashboard by:
- Connecting it to a real database
- Adding data visualization using matplotlib or tkinter.ttk.Treeview
- Creating user authentication and multi-page navigation
✅ Conclusion
This project demonstrates how to use Tkinter to build a professional-looking admin dashboard interface. Whether you’re a beginner or looking to build internal tools, this example is a great starting point to learn GUI design with Python.
Happy coding! 🎉
Disclaimer
Sengideons.com does not host any files on its servers. All point to content hosted on third-party websites. Sengideons.com does not accept responsibility for content hosted on third-party websites and does not have any involvement in the same.


